K-means Clustering
- What is Clustering?
- K-Means Intuition
- K-Means Algorithm
- Optimization Objective
- Initializing K-Means
- Choosing the Number of Clusters
- Implementation of K-Means in Python
- Choosing the Number of Clusters
- Advantages and Disadvantages of K-Means
- Conclusion
What is Clustering?
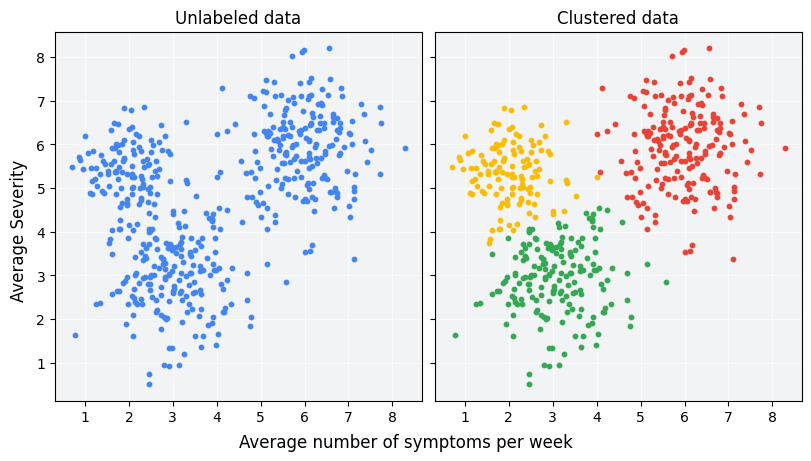
Clustering is an unsupervised learning technique used to group data points into distinct clusters based on their similarities. Unlike supervised learning, clustering does not rely on labeled data but instead identifies underlying structures within a dataset.
Applications of Clustering
- Customer Segmentation: Identifying groups of customers with similar purchasing behaviors.
- Anomaly Detection: Detecting fraudulent activities in financial transactions.
- Image Segmentation: Partitioning an image into meaningful regions.

- Document Categorization: Grouping documents with similar topics.
- Genomics: Identifying gene expression patterns and categorizing biological data.
- Social Network Analysis: Detecting communities within a network.
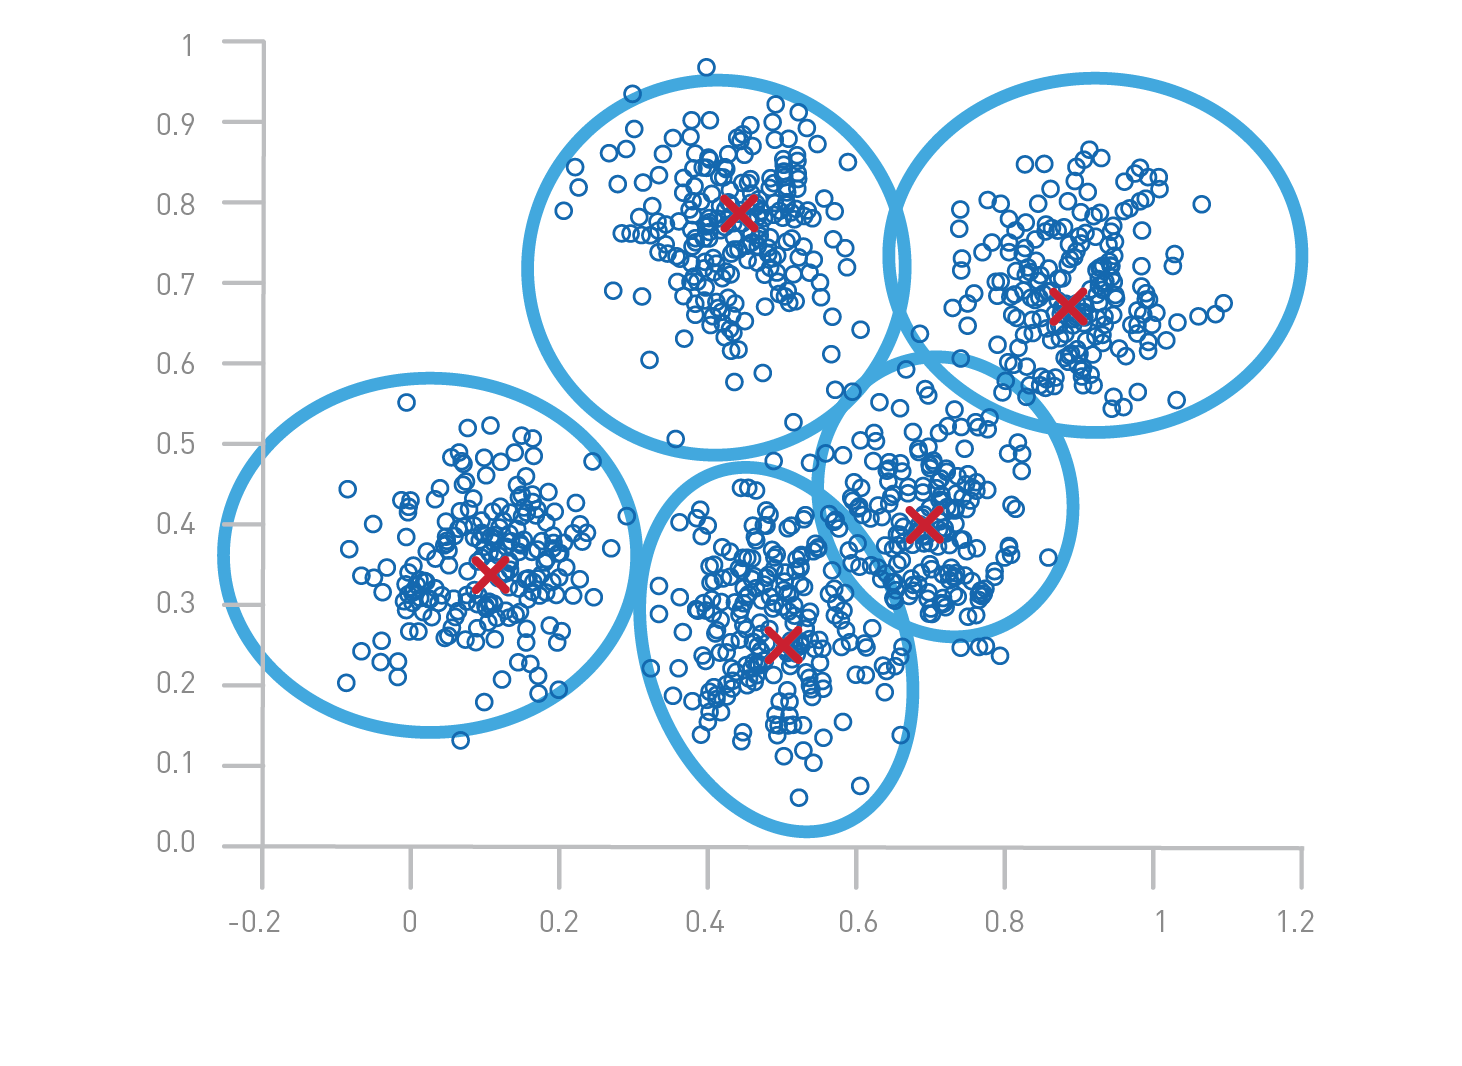
K-Means Intuition
K-Means is one of the most widely used clustering algorithms due to its simplicity, efficiency, and scalability. The primary goal of K-Means is to partition a given dataset into K clusters by minimizing intra-cluster variance while maximizing inter-cluster differences.
Key Intuition:
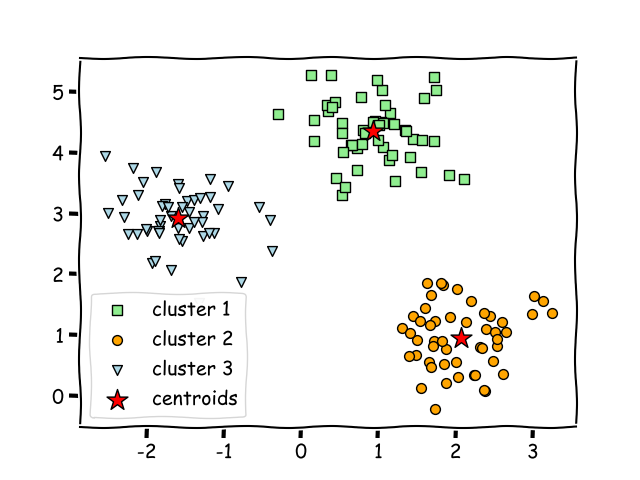
- Data points within the same cluster should be as similar as possible.
- Data points in different clusters should be as distinct as possible.
- The centroid of each cluster represents the
averageof all points in that cluster. - The algorithm iteratively improves the clusters until convergence.
K-Means Algorithm
The K-Means algorithm follows these steps:
- Initialize K cluster centroids randomly or using a specific method (e.g., K-Means++).
- Assign each data point to the nearest centroid using Euclidean distance:
- Update centroids by computing the mean of all points assigned to each cluster:
where is the number of points in cluster .
- Repeat until centroids stabilize (do not change significantly between iterations).
Optimization Objective
Consider data whose proximity measure is Euclidean distance. For our objective function, which measures the quality of a clustering, we use the sum of the squared error (SSE), which is also known as scatter.
In other words, we calculate the error of each data point, i.e., its Euclidean distance to the closest centroid, and then compute the total sum of the squared errors. Given two different sets of clusters that are produced by two different runs of K-means, we prefer the one with the smallest squared error, since this means that the prototypes (centroids) of this clustering are a better representation of the points in their cluster.
where:
- is a data point.
- is the centroid of cluster .
- is 1 if belongs to cluster , otherwise 0.
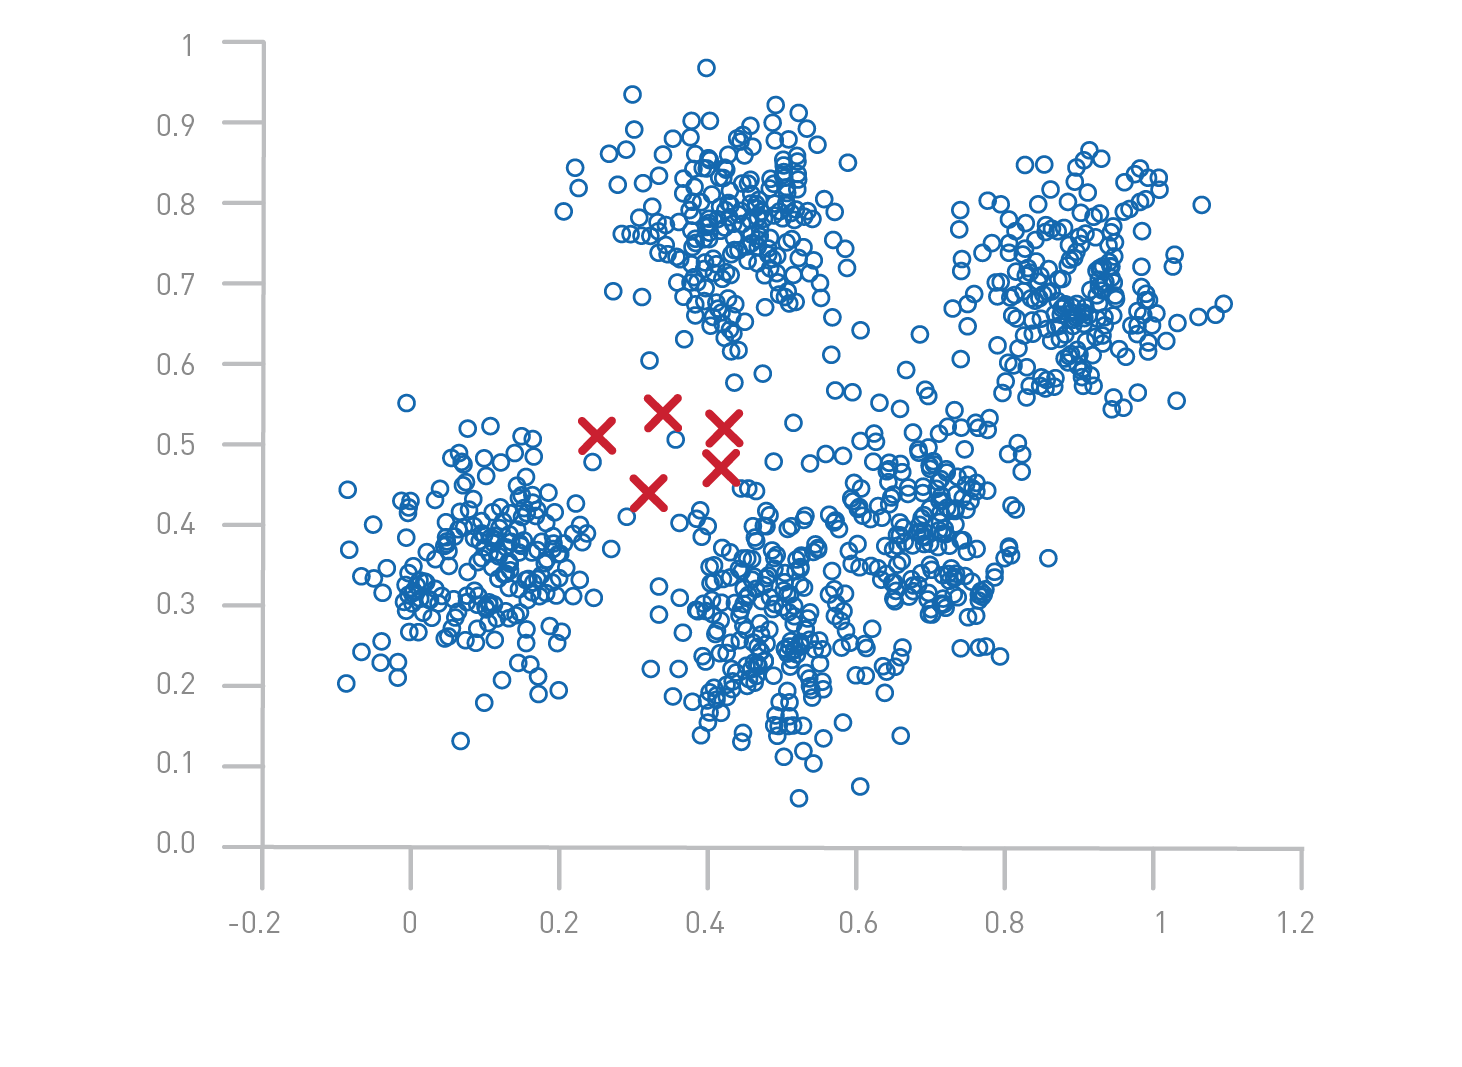
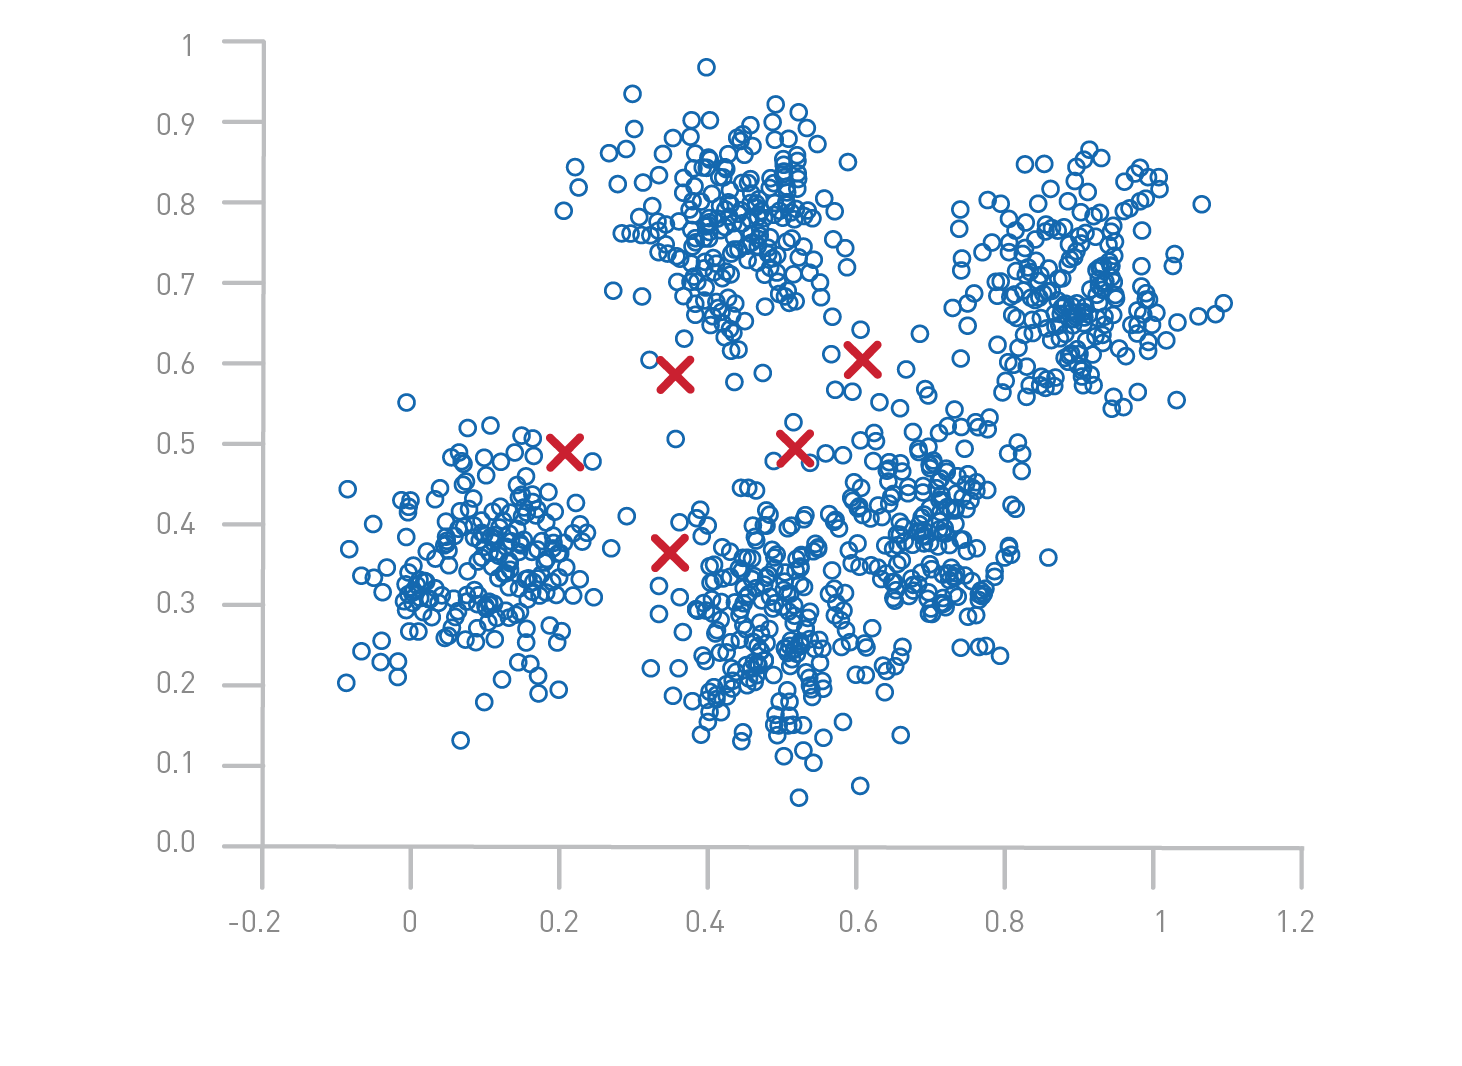
Initializing K-Means
Initialization significantly affects K-Means performance and results. Common initialization methods include:
- Random Initialization: Choosing K random points from the dataset.
- K-Means++ Initialization: A smarter method that spreads initial centroids to improve convergence speed and reduce the risk of poor clustering results.
- Forgy Method: Selecting K distinct data points as initial centroids.
Choosing the Number of Clusters
Selecting the appropriate number of clusters (K) is crucial. Common methods include:
- Elbow Method: Plotting WCSS vs. K and identifying the ‘elbow’ point.
- Silhouette Score: Measuring how similar a data point is to its own cluster vs. other clusters.
- Gap Statistic: Comparing WCSS against a random distribution to determine the optimal K.
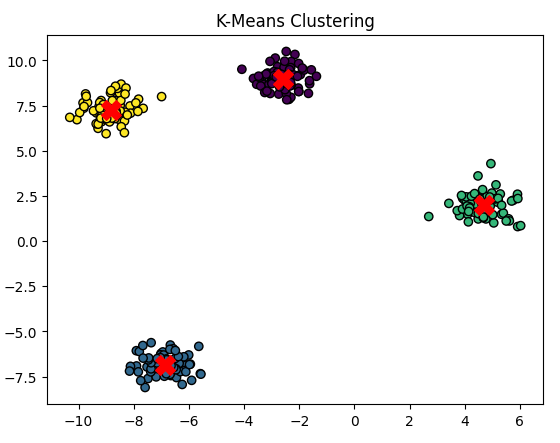
Implementation of K-Means in Python
import numpy as np
import matplotlib.pyplot as plt
from sklearn.cluster import KMeans
from sklearn.datasets import make_blobs

# Create a synthetic dataset
X, _ = make_blobs(n_samples=300, centers=4, cluster_std=0.6, random_state=42)

# Apply K-Means
kmeans = KMeans(n_clusters=4, random_state=42)
kmeans.fit(X)
labels = kmeans.labels_
centroids = kmeans.cluster_centers_

# Plot the clusters
plt.scatter(X[:, 0], X[:, 1], c=labels, cmap='viridis', marker='o', edgecolor='black')
plt.scatter(centroids[:, 0], centroids[:, 1], s=200, c='red', marker='X')
plt.title("K-Means Clustering")
plt.show()
Choosing the Number of Clusters
Selecting the appropriate number of clusters (K) is crucial for obtaining meaningful results from K-Means clustering. Choosing too few clusters may result in underfitting, while choosing too many can lead to overfitting and unnecessary complexity. Several techniques help determine the optimal K:
1. Elbow Method
The Elbow Method is a widely used heuristic for selecting K by analyzing the Within-Cluster Sum of Squares (WCSS), also known as inertia.
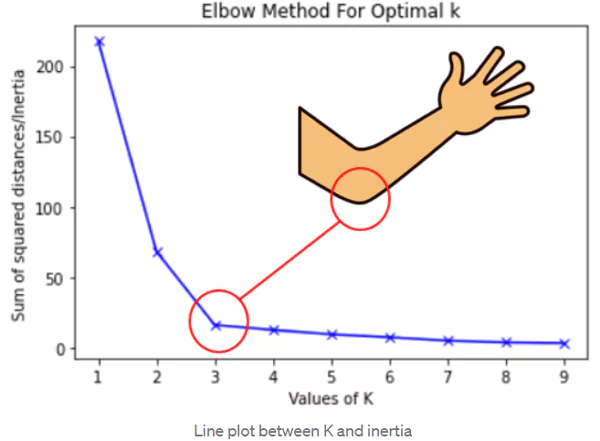
Steps:
- Run K-Means clustering for different values of K (e.g., from 1 to 10).
- Compute WCSS for each K. WCSS is defined as: where is the centroid of cluster and is a data point in that cluster.
- Plot WCSS vs. K and look for an ‘elbow’ point where the rate of decrease sharply changes.
- The optimal K is chosen at the elbow point, where adding more clusters does not significantly reduce WCSS.
2. Silhouette Score
The Silhouette Score measures how well-defined the clusters are by computing how similar a data point is to its own cluster compared to other clusters. It ranges from to :
- 1: Data point is well-clustered.
- 0: Data point is on the cluster boundary.
- -1: Data point is incorrectly clustered.
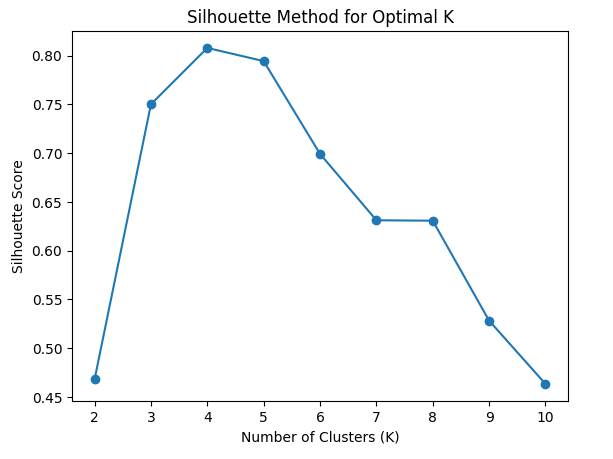
Steps:
- Compute the mean intra-cluster distance for each data point.
- Compute the mean nearest-cluster distance for each data point.
- Compute the silhouette score for each point:
- The overall Silhouette Score is the average of all .
- The optimal K is the one maximizing the Silhouette Score.
3. Gap Statistic
The Gap Statistic compares the clustering quality of the dataset against a random uniform distribution. It helps determine if a given clustering structure is significantly better than random clustering.
Steps:
- Run K-Means for different values of K and compute the within-cluster dispersion .
- Generate a random dataset with a similar range and compute .
- Compute the gap statistic: where is the number of random datasets.
- Choose the smallest K where is significantly large.
Advantages and Disadvantages of K-Means
Advantages
- Simplicity: Easy to understand and implement.
- Scalability: Efficient for large datasets.
- Fast Convergence: Typically converges in a few iterations.
- Works well for convex clusters: If clusters are well-separated, K-Means performs effectively.
- Interpretable Results: Clusters can be easily visualized and analyzed.
Disadvantages
- Choice of K: Requires prior knowledge or heuristic methods to select the number of clusters.
- Sensitivity to Initialization: Poor initial centroid selection can lead to suboptimal results.
- Not Suitable for Non-Convex Shapes: Struggles with arbitrarily shaped clusters.
- Affected by Outliers: Outliers can skew centroids, leading to poor clustering.
- Equal Variance Assumption: Assumes clusters have similar variance, which may not always hold.
Example of Poor Performance: If the dataset contains clusters with varying densities or non-spherical shapes, K-Means may misclassify data points. Alternatives like DBSCAN or Gaussian Mixture Models (GMMs) may perform better in such cases.
Conclusion
K-Means is a powerful clustering technique widely used across industries. While it is simple and efficient, it has limitations such as sensitivity to initialization and difficulty handling non-convex clusters. However, by applying optimization techniques and careful selection of K, it remains a strong tool in unsupervised learning.